Is Kew Gardens Safe? Queens Livability, Crime & Rent
Kew Gardens scores 6.3 composite—a tree-rich, service-dense neighborhood with notable commute friction and rising crime concerns.
Kew Gardens at a glance
- Borough
- Queens
- Livability score
- 6.3/10
- Borough rank
- #7 of 27
- Safety verdict
- Much Safer Than Average
- Crimes (12 mo)
- 988
- Subway stations
- 1 (Briarwood)
- Active listings
- 3
- Data updated
- 2026-04-05
Is Kew Gardens Safe?
Kew Gardens, Queens scores 6.3/10 for overall livability, ranking #7 of 27 Queens neighborhoods. Kew Gardens scores 6.3 composite—a tree-rich, service-dense neighborhood with notable commute friction and rising crime concerns.
This score aggregates live NYPD crime data, 311 safety complaints, shooting incidents, and building health signals within walking distance. Safety varies by block — check a specific Kew Gardens address below for a block-level breakdown.
Score Overview
Vertical line = borough median. Scale: 0-10.
Neighborhood Character
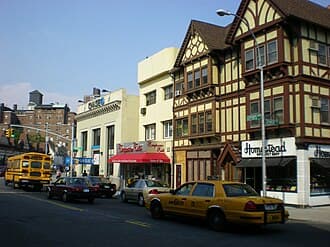
Kew Gardens reads as a tree-dense, architecturally distinct neighborhood anchored by its village center and proximity to Forest Park. You'll find an average of 97 trees within 200 meters of any address, with a canopy density of 9.5/10—among the greenest pockets in Queens. The built environment is predominantly mid-rise (67%), mixed with walk-ups, and characterized by Tudor Revival and period homes that give the neighborhood visual consistency. Three parks anchor the area: Maple Grove Park, Eight Oaks Triangle, and Metro Triangle, each within roughly 472 meters of residents. The E and F trains serve the neighborhood via Briarwood station, though commute times run longer than borough averages.
Analysis based on 3 properties scored across 30+ data points

Livability & Restoration
Tree Canopy
97 trees
Avg within 200m | Density: 9.5/10
10 additional trees per block correlates with health benefits equivalent to being 7 years younger (Kardan et al., 2015)
Park Access
Maple Grove Park
Avg 472m away | Score: 2.6/10
Living within 300m of green space associated with 30% fewer antidepressant prescriptions (Taylor et al., 2015)
Acoustic Quality
6/10
Noise proxy score (higher = quieter)
Chronic noise above 55 dB at night associated with 8% cardiovascular mortality increase (Basner et al., 2014)
Street Character
0/10
Enclosure: 0/10
What is the ART Score?
ART stands for Attention Restoration Theory (Kaplan & Kaplan, 1989) — the framework environmental psychologists use to measure whether a place helps your brain recover from mental fatigue, or pushes it deeper into overload. Cities deplete directed attention (the effortful focus you use at work); exposure to restorative environments replenishes it.
We compute an ART score for every block by combining four signals: access to restorative zones (parks, museums, libraries), sensory load (nightlife and tourist density), street vitality (Jane Jacobs’ “eyes on the street”), and third places (Oldenburg’s informal community spaces).
Meaningfully more restorative than the Queens average — expect lower sensory load and better access to restorative zones than most of the borough.
What drives the score
- +Restorative zones. Museums, libraries, community gardens, and parks within walking distance. “Soft fascination” stimuli (clouds, tree branches, water) let directed attention recover without effort — the Kaplans’ core mechanism.
- −Sensory load. Bar and nightclub density (5+ within 150m), firehouse siren corridors, tourist chokepoints, and very high foot traffic push the score down by up to 8 points.
- +Street vitality (Jacobs, 1961). Permitted block parties, farmers markets, and community festivals over the past 12 months — a proxy for “eyes on the street” and the informal surveillance that makes blocks feel safe and maintained.
- +Third places (Oldenburg, 1989). Cafés, public plazas (POPS), community centers — the “anchors of community life” that buffer against social isolation. Loneliness has been linked to 29% higher incident coronary heart disease risk (Valtorta et al., 2016).
Health mechanism. Directed-attention fatigue (DAF) is linked to impaired decision-making, irritability, and elevated cortisol. A meta-analysis of 60+ studies (Ohly et al., 2016) found restorative environment exposure significantly improves attention-task performance (Hedges’ g ≈ 0.32) and reduces negative affect.
Theoretical foundations. Kaplan & Kaplan (1989), The Experience of Nature; Jacobs (1961), The Death and Life of Great American Cities; Oldenburg (1989), The Great Good Place.

Transit & Commute
Subway Stations
Commute Score
3.5/10
Borough median: 5.5/10
Walk Score Proxy
0/10
Based on street geometry analysis

Investment Indicators
Multi-Family Stock
0%
2-4 family buildings
Multi-family owner-occupants build 2.4x wealth vs single-family (Herbert, 2013)

Outdoor & Green Space
Avg Tree Count
97
Within 200m radius
Canopy Density
9.5/10
Normalized canopy coverage
Park Network
- Maple Grove Park
- Eight Oaks Triangle
- Metro Triangle
Avg distance: 472m

Practical Living
Building Types
Who Kew Gardens Is For
Green-space prioritizers
Canopy density of 9.5/10 and 97 average trees per 200m radius place this among Queens's most tree-rich neighborhoods; ART/Livability score of 6.8 reflects strong outdoor amenities.
Transit-dependent professionals
E/F service via Briarwood provides reliable subway access, though commute score of 3.5 indicates longer travel times to major job centers compared to borough median of 5.5.
Neighborhood stability seekers
Strong practical score (9/10) reflects reliable services and established infrastructure; Tudor architecture and village center create cohesive streetscape appeal.
Pros & Cons
Strengths
Exceptional tree canopy and green infrastructure
97 trees within 200m radius with 9.5/10 canopy density—significantly above borough comparables
Strong neighborhood services and walkability
Practical score of 9/10, highest in the dataset; village center and Courthouse proximity support daily-need accessibility
Architectural character and visual cohesion
Tudor-style building stock and established neighborhood identity differentiate Kew Gardens from surrounding areas
Forest Park adjacency
Direct access to one of Queens's largest green spaces and recreational anchors
Trade-offs
Significantly longer commute times
Commute score of 3.5 vs. borough median of 5.5; E/F service is the primary transit option
High noise complaints
1,398 noise complaints recorded—flagged as 'Very High' and suggesting traffic, construction, or quality-of-life friction
Worsening crime trend
Total crimes over 12 months: 707, with year-over-year trend up 129.5%—significant deterioration despite average safety percentile (85th)
Limited transit redundancy
Reliance on single E/F line creates vulnerability; no alternative subway routes serve the neighborhood directly
Score Any Address in Kew Gardens
Get detailed livability scores based on building health, transit access, safety, noise levels, and 15+ NYC data sources.
Search an Address in Kew GardensFrequently Asked Questions about Kew Gardens
1Is Kew Gardens safe?
By NYPD data, Kew Gardens is rated "Much Safer Than Average" — safer than 79% of Queens neighborhoods. 988 crime incidents and 0 shooting incidents over the past 12 months. See the safety page for the full breakdown.
2What is the average rent in Kew Gardens?
Rents in Kew Gardens, Queens vary significantly by building and apartment type. Market pricing isn't aggregated for this neighborhood yet; use DwellCheck to research specific addresses for rent-stabilization status, HPD violations, and building-level signals that affect what you'll actually pay.
3How is transit access in Kew Gardens?
Kew Gardens has a commute score of 3.5/10. 1 subway stations serve the area: Briarwood.
4What are the best streets in Kew Gardens?
The best streets depend on your priorities. Use DwellCheck to compare specific addresses across livability, safety, transit, and environmental factors.
5What is Kew Gardens known for?
Kew Gardens sits in Queens and ranks #7 of 27 Queens neighborhoods on DwellCheck's livability score (6.3/10). It's served by 1 subway station (Briarwood). Kew Gardens scores 6.3 composite—a tree-rich, service-dense neighborhood with notable commute friction and rising crime concerns.
6What is it like to live in Kew Gardens?
Living in Kew Gardens, Queens weights against six livability dimensions: practical (HPD-violation density), commute (subway proximity), arts/culture (venue density), outdoor (parks + trees), financial (price level), investment (price trend). Kew Gardens's composite is 6.3/10. Kew Gardens scores 6.3 composite—a tree-rich, service-dense neighborhood with notable commute friction and rising crime concerns. For the block-by-block view, run any specific Kew Gardens address through DwellCheck.
7Can you walk around Kew Gardens at night?
Kew Gardens is classified as "Much Safer Than Average" by NYPD CompStat data. Over the past 12 months it recorded 0 shooting incidents and 988 total crime incidents. Walking at night carries the same risk profile as anywhere in NYC: stay on commercial corridors with foot traffic, avoid empty side streets after midnight, and prefer subway lines that run 24/7.
8Is Kew Gardens dangerous?
By NYPD data, Kew Gardens is rated "Much Safer Than Average" — safer than 79% of Queens neighborhoods. 988 crime incidents over 12 months. Block-level risk varies; check the address-level safety score for any specific street or building.
9What parts of Kew Gardens should I avoid?
NYPD CompStat reports incidents at the precinct level, not block-by-block, so a granular "avoid this street" answer isn't possible from public data alone. The most reliable signal at the block level is DwellCheck's address-level safety score, which weights NYPD incidents within a 250m radius of a specific building. As a general rule across NYC: industrial blocks with no foot traffic are higher-risk than residential blocks; subway-station-adjacent commercial corridors are lowest-risk.
10Is Kew Gardens a good place to live?
Kew Gardens scores 6.3/10 for overall livability and ranks in the 79th percentile for safety in Queens. Kew Gardens scores 6.3 composite—a tree-rich, service-dense neighborhood with notable commute friction and rising crime concerns. Whether it's a good fit depends on what you weight: families, solo renters, and remote workers each prioritize different factors (noise, transit access, parks, building quality).
11What is the average DwellScore in Kew Gardens?
Median composite score is 6.3 (interquartile range 5.9–6.7). Practical amenities and livability score high (9.0 and 6.8 respectively), while commute (3.5) and financial/investment scores (both 5.0) drag the overall rating down.
12How safe is Kew Gardens?
Safety verdict is 'average' at the 85th percentile within Queens. However, total crimes over 12 months reach 707, and year-over-year crime increased 129.5%—a steep worsening trend that warrants attention.
13Is Kew Gardens good for commuting?
No—commute score of 3.5 is well below the borough median of 5.5. E/F service via Briarwood is the primary option; travel times to major job centers are longer than neighboring areas.
14What makes Kew Gardens livable day-to-day?
Strong practical score (9/10) reflects reliable neighborhood services, walkable village center, and Courthouse proximity. Exceptional tree canopy (97 trees per 200m, 9.5/10 density) and three nearby parks support outdoor living. Architectural cohesion around Tudor-style homes adds visual consistency.
Related Guides
NYC Building Complaints Lookup
Check any building's HPD, DOB, and 311 complaint history before signing.
30 NYC Apartment Red Flags
What to watch for at the viewing, in the listing, and on the landlord.
How to Check Your NYC Landlord
A 5-step free lookup: ACRIS ownership, HPD violations, DOB complaints, lawsuits.
Is My Apartment Rent-Stabilized?
Request a free DHCR rent history and verify stabilization status in 24-72 hours.